How To Create a Chart in Google Docs
Creating charts is an essential part of data analysis and visualization, and Google Docs offers a built-in tool for creating charts easily. In this guide, we will walk you through the steps on how to create a chart in Google Docs. So, let’s dive in!

Why should you use charts in Google Docs?
Charts in Google Docs are perfect for visualizing and comparing different data sets, analyzing trends over time, illustrating percentages, and much more. They can be used in various scenarios, such as business presentations, academic research papers, project updates, and feedback gathering. With charts, you can quickly and visually showcase data, making it easier for your audience to understand complex information.
Types of charts available in Google Docs
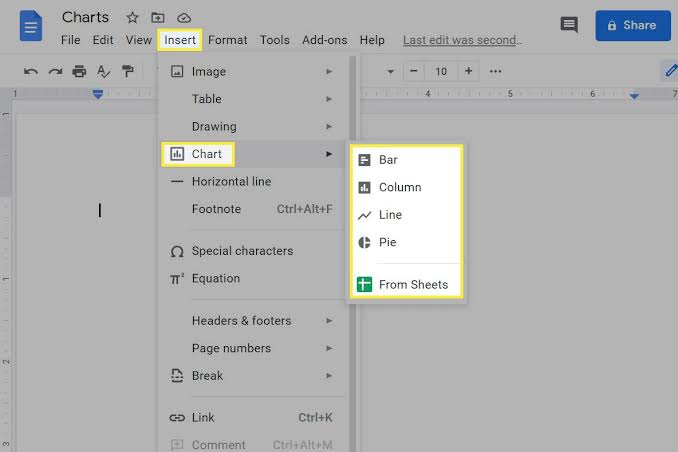
Google Docs provides four types of charts that you can create instantly:
- Bar
- Column
- Line
- Pie
If you need to present your data in a table format instead, you can select “Insert > Table” from the toolbar.
How To Create a chart in Google Docs
Creating a chart in Google Docs is a straightforward process. Although you can’t create a chart using Google Docs on a mobile device, you can do so using the browser version of Google Docs. To create a chart, follow these steps:
- Open a new Google document.
- Select “Insert > Chart” from the toolbar.
- Choose the type of chart you prefer to insert, or select “From Sheets” to use a chart that you’ve already created in Google Sheets.
- Once you select a chart, it will appear in your Google document automatically.
How To Edit a Chart in Google Docs
While you can’t edit a chart from inside Google Docs, you can edit it from Google Sheets. To do so, follow these simple steps:
- Select the chart and then click the dropdown menu located at the top right corner of the chart.
- Select “Open source.”
- Google Sheets will open the document that the chart is based on. Edit the data as needed.
- Once done, go back to Google Docs, and from the dropdown menu, select “Update” to see the changes in the chart.
You can also customize the color of the chart and other options by selecting “Image Options” from the toolbar.
More ways to use Google Docs
Google Docs is more than just a simple document creation app. It’s an all-in-one tool for document sharing, editing, and collaboration. The possibilities are endless, and you can use it for creating presentations, designing infographics, formatting papers, and much more.
To get our latest news once they’re published, please follow us on Google News, Telegram, Facebook, and Twitter. We cover general tech news and are the first to break the latest MIUI update releases. Also, you get issues-solving “How To” posts from us.


